
The summary report provides a descriptive and gap analysis of findings on immunization delivery costs
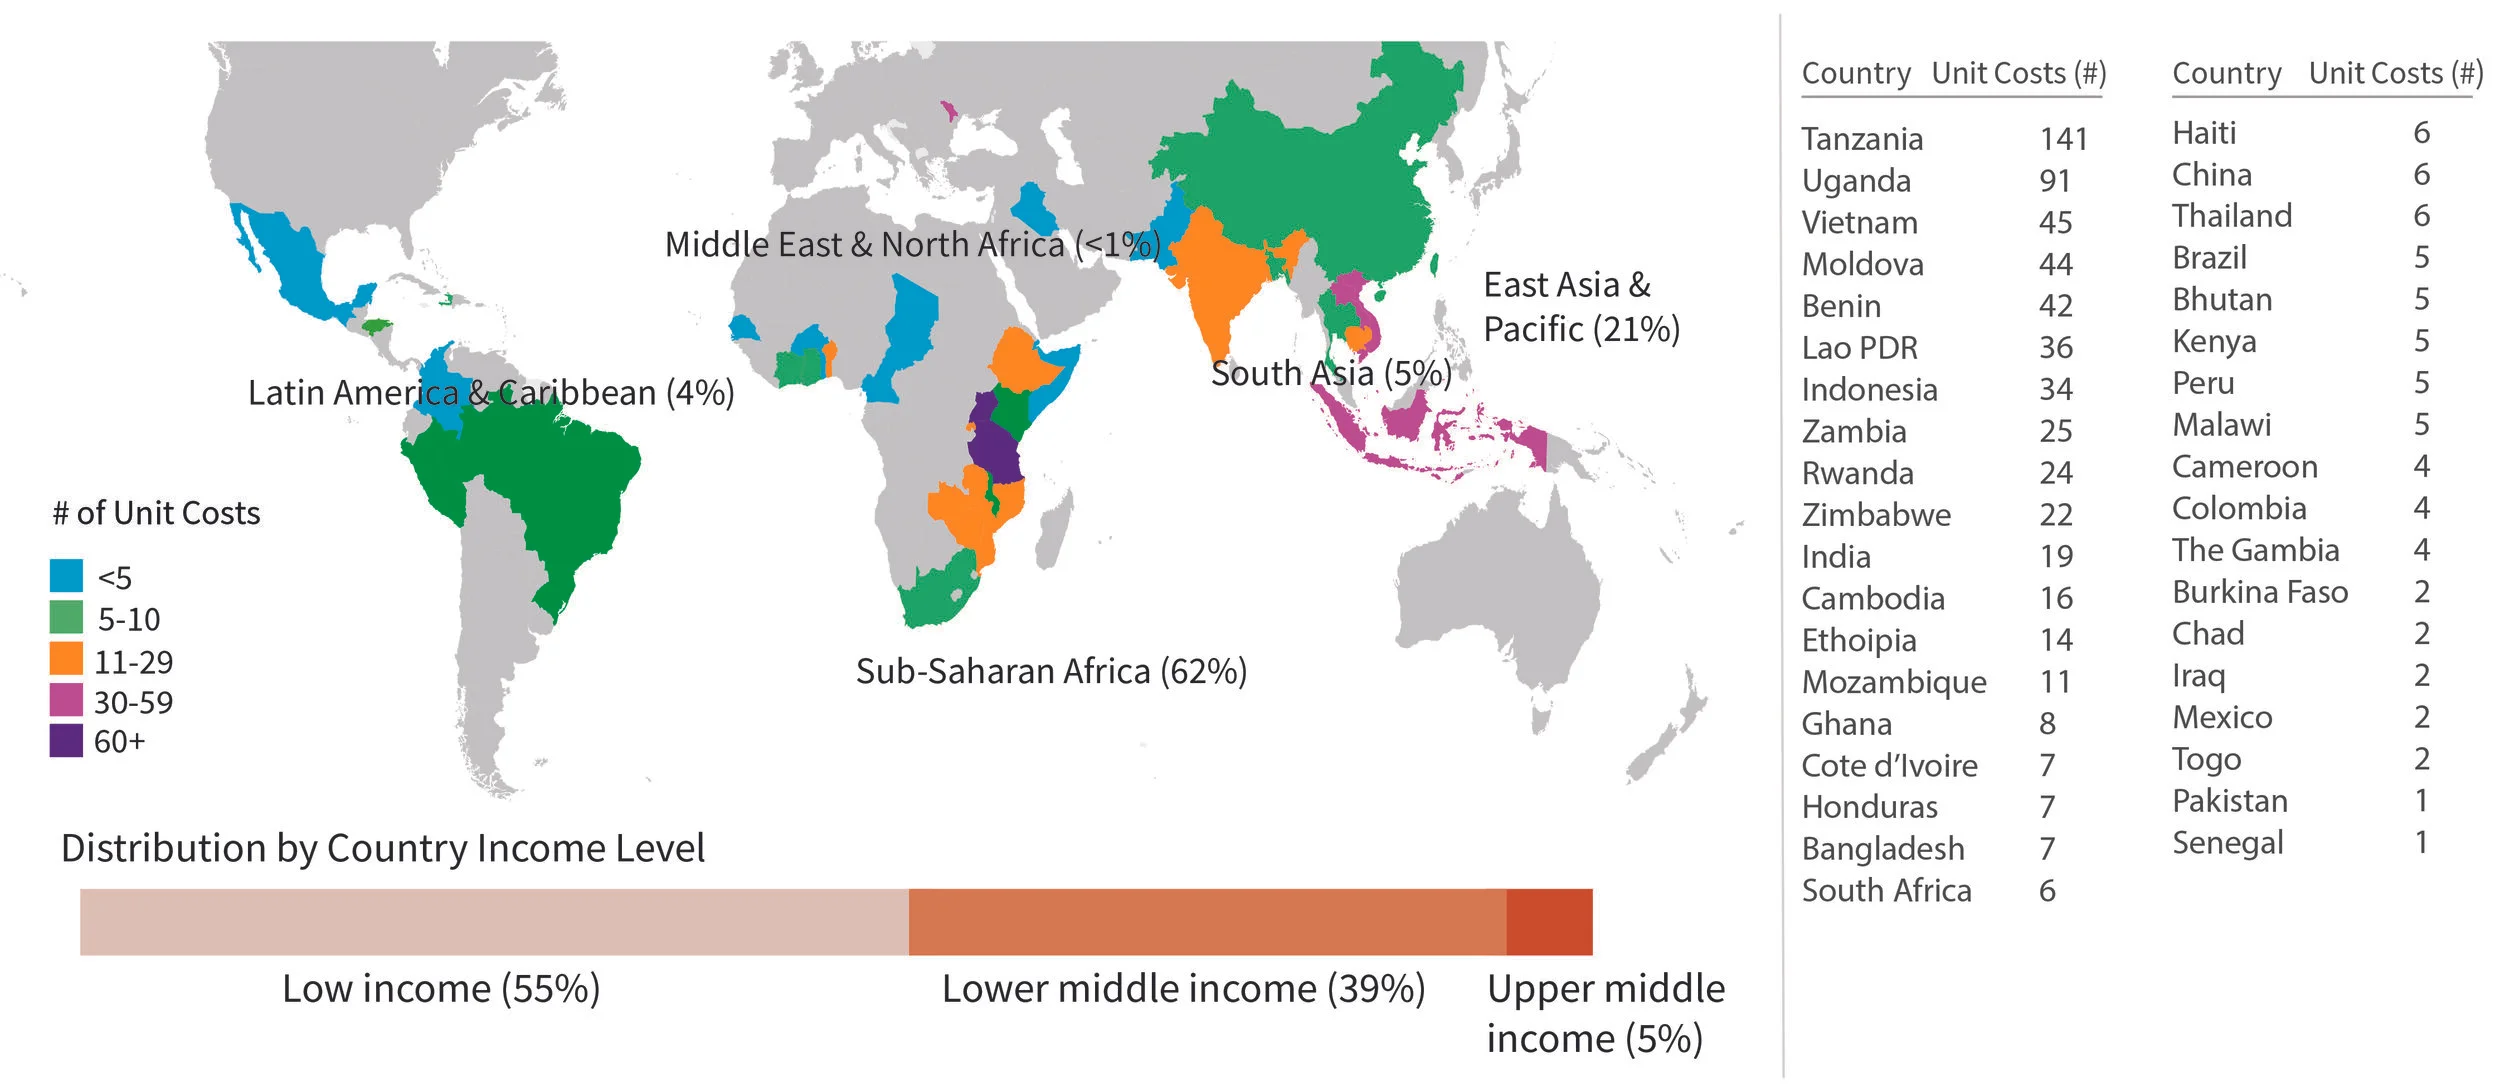
WHERE DO THE DATA COME FROM?
WHICH VACCINES WERE INCLUDED?
57% of the immunization delivery unit costs are for single vaccines.
Of the single vaccines, most unit costs are for HPV, PCV, and Rotavirus.
Note: Percentages do not sum to 100% due to rounding. There were no articles with immunization delivery unit cost estimates for Inactivated Poliovirus Vaccine (IPV).
Codes: BCG = Bacillus Calmette-Guérin; DTP = Diphtheria and tetanus toxoids and whole-cell pertussis vaccine, pediatric formulation; HepB = Hepatitis B; Hib = Haemophilus influenzae type b; HPV = Human Papillomavirus; JE = Japanese Encephalitis; OCV = Oral Cholera Vaccine; OPV = Oral Polio Vaccine; PCV = Pneumococcal Conjugate Vaccine (7-, 10-, or 13-valent); TT = Tetanus Toxoid
WHICH VACCINE DELIVERY STRATEGIES WERE COSTED?
48% of unit costs are for vaccines costed were delivered in a health facility.
10% of unit costs are for vaccines delivered in schools, and of these, 78% are focused on HPV introduction.
* Three resources are not shown in the figure as they did not report the delivery strategy(ies) used (less than 1%).
** Includes child health days/weeks or national immunization days/weeks.
*** Refers to a combination of two or more delivery strategies.
Our analysis resulted in nine immunization delivery cost ranges comprised of comparable unit costs grouped in three comparative visuals
All cost ranges exclude vaccine costs and are reported in 2016 US$. Cost ranges can be helpful for planning and budgeting purposes when more detailed or context-specific data is unavailable. Suitability of the estimates for use for planning and budgeting, or for advocacy and fundraising, should be carefully considered in light of the context(s) the estimates will be applied in.
Figure 1: The diagram below depicts the incremental cost per dose to deliver a single, newly introduced vaccine such as PCV or Rotavirus (3-dose) at health facilities in low-income countries. We estimate these costs to be $0.48 to $1.38 (economic costs) and $0.16 to $2.54 (economic, financial, and fiscal costs). Full immunization (three doses) ranges from $1.45 to $4.20 (economic costs).
Figure 2: The diagram below depicts the cost of introducing HPV vaccine. Introducing HPV on a pilot/project basis at health facilities, schools and using multiple delivery strategies costs $1.74 to $4.29 (incremental costs). The lower end of the range represents financial costs, shown by the cost range on the left, whereas the higher end of the range corresponds with economic costs, shown by the cost range on the right.
Figure 3: The diagram below depicts the full costs for delivering schedules of vaccines. Delivering a schedule of five to six antigens for under 18 month olds costs $0.66 to $3.51 (full, financial costs). We estimate the costs of delivering a schedule of four to eight antigens for under one-year-olds range from $0.75 to $9.45 (full, economic costs). This equates to a cost per fully immunized child (children who have received DTP3) of $8.13 to $96.16.
Figure 4: The diagram below depicts the supply chain only costs for delivering schedules of vaccines. The full, economic cost per dose of delivering vaccination schedules containing 6 to 7 antigens range from $0.22 to $0.33.
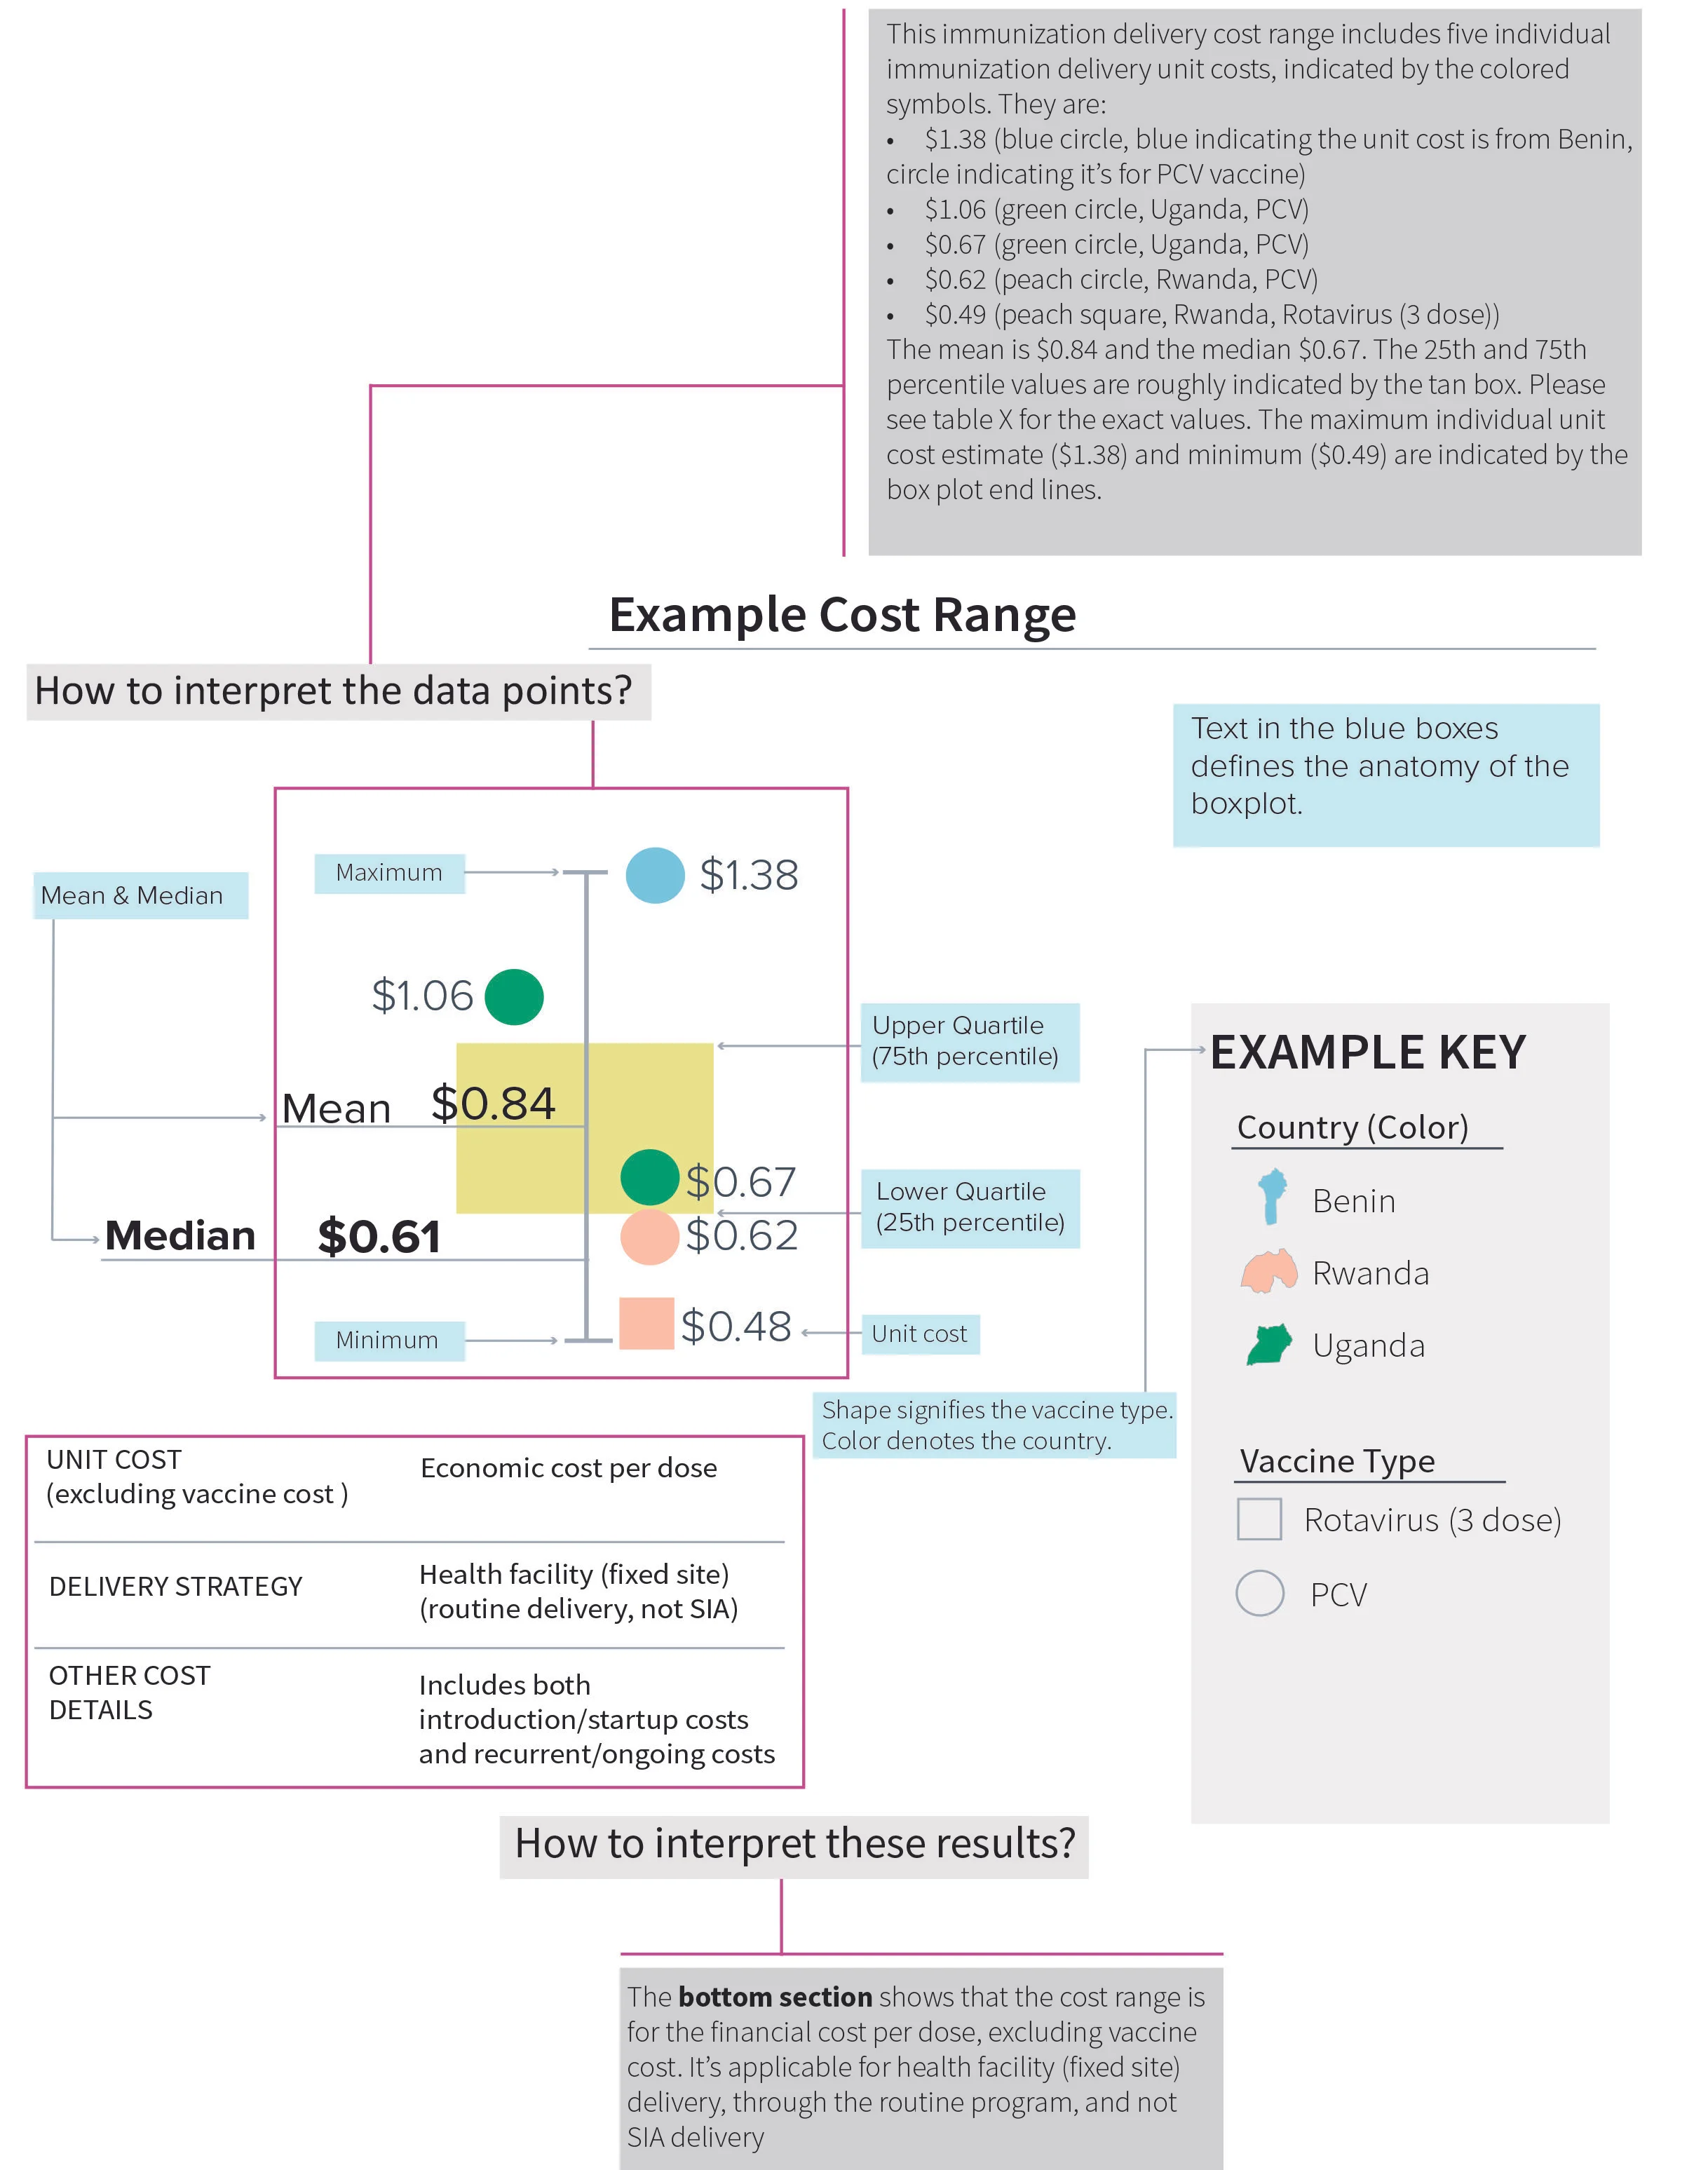
COST RANGES EXPLAINED:
These figures provide an in-depth look at the components of the boxplot with more details on how to interpret the cost ranges.
© 2020, Immunization Costing Action Network (ICAN), ThinkWell, LLC. All rights reserved.
immunizationeconomics@thinkwell.global